How did I collect my data and what did I do with it?
When I held my bake sales, I kept track of the money I made using google spread sheets. I did that for the money that was spent on purchasing material for the bake sales. After gathering my information, I looked at how much I actually made and the is where income and profit came in. Income is associated with the total amount made from the days or in other words the "overall total" of the sale. Profit is what one actually earned from the sale, one gets that by subtracting the income price from the cost price. It is better for a company or seller to have the income be higher then the cost, this way they can make profit. After doing a lot of math I graphed information using the application that apple had to offer called numbers.
Overall Money Analysis

|
From the last week of January to the first week of May, the amount of money I spent was $162.06. $508.45 is the total income made made from the bakes sales. The overall profit made is $340.39 because $508.45 - $162.06 = $340.39. |
Bake Sale Data

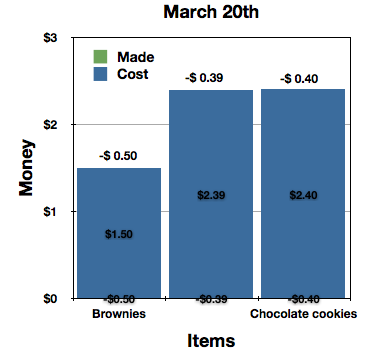
In order to look at individual data, I looked at each weeks cost, income, and profit. The amount of profit made for each week at least tripled besides March 20th. The income of March 20th was only five dollar when I had actually spent $ 6.29. On that day I actually lost money because I had not sold much. One of the pit fall of that day was that it was a friday and there were many things going on such as teachers taking their students out for event. That was not good for me because that meant losing money. However, I like the fact that data is there because it allowed me to see what happens to a business when other competition rolls in.
BAKE SALE DATA by month and week

|
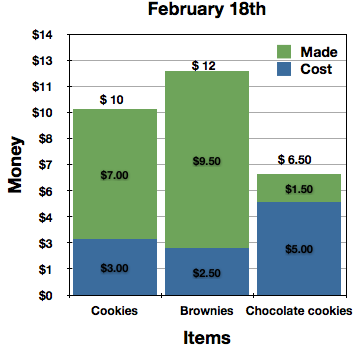
January 28th was my first bake sale. I did not know what to expect, accept that it will hopefully go well. After looking at the information, I simply learned that the more of a product I had the more money I made of off it because there was more of it.
|
Looking at Wednesday Vs. Friday

|
|
In order to make my data analysis a bit interesting Ms. Echols, my awesome mentor, suggested why not look at which day of the week do you many more profit. Taking her suggestion and looking at my schedule I first picked Wednesday and Friday. From the graphs Friday was the day that I made more profit. Not because I had more things but also because people were not rushing out of the door since SLA gets out at 12:50 on Wednesdays.
LOOKING AT Monday VS. FRIDAY
|
|
I then compared Monday and Friday. After the comparison, Monday had more profit because on 20th of March teachers were taking their students to outside event. This meant there were not that many people in the school to buy the baked goods. However, this allowed me to understand what happens when a store has to go against competition.

April 17th was when I first made the most money from my bake sales. For this day I decided to increase the amount of products. I also added an extra items this day and that was candy bars. I decided to do this because this was a way of bringing in customers by using other materials.
Looking at Wednesday

|

|
Later in the school year, Wednesday became the day that people ended up buying more products. On April 22nd, I sold to different items and April 29th I had more items. Either way, the more items I had meant more profit.

May 6th was the day second day I made the most profit. This day I also had a various products but the main reason this day made a lot was because brownies and candies.
Looking at each product sold

Throughout all the sales I had many different items. Many were one time things to see how they sale compared to other products. My overall conclusion to this is that brownies, candies, and store brought cookies sold the most. People had a huge requirement for the brownies that I made, which was good. I do not know how to keep my homemade cookies soft so compared to the store brought ones they did not sale that well. And as for candies, everyone liked them as well. One thing, I wish I would have done was looked at which variety pack of candy sold more. Overall looking at each item helps me understand, what a bakery looks at when they made new products to sale to their customers.
